Undercover: Indian Stock Market Pattern
Most people think the stock market is random - a chaotic mix of noise, news, and luck. But when you step back and really look at the data over decades, something interesting appears. The market behaves less like chaos and more like a story — one that repeats itself with surprising consistency.
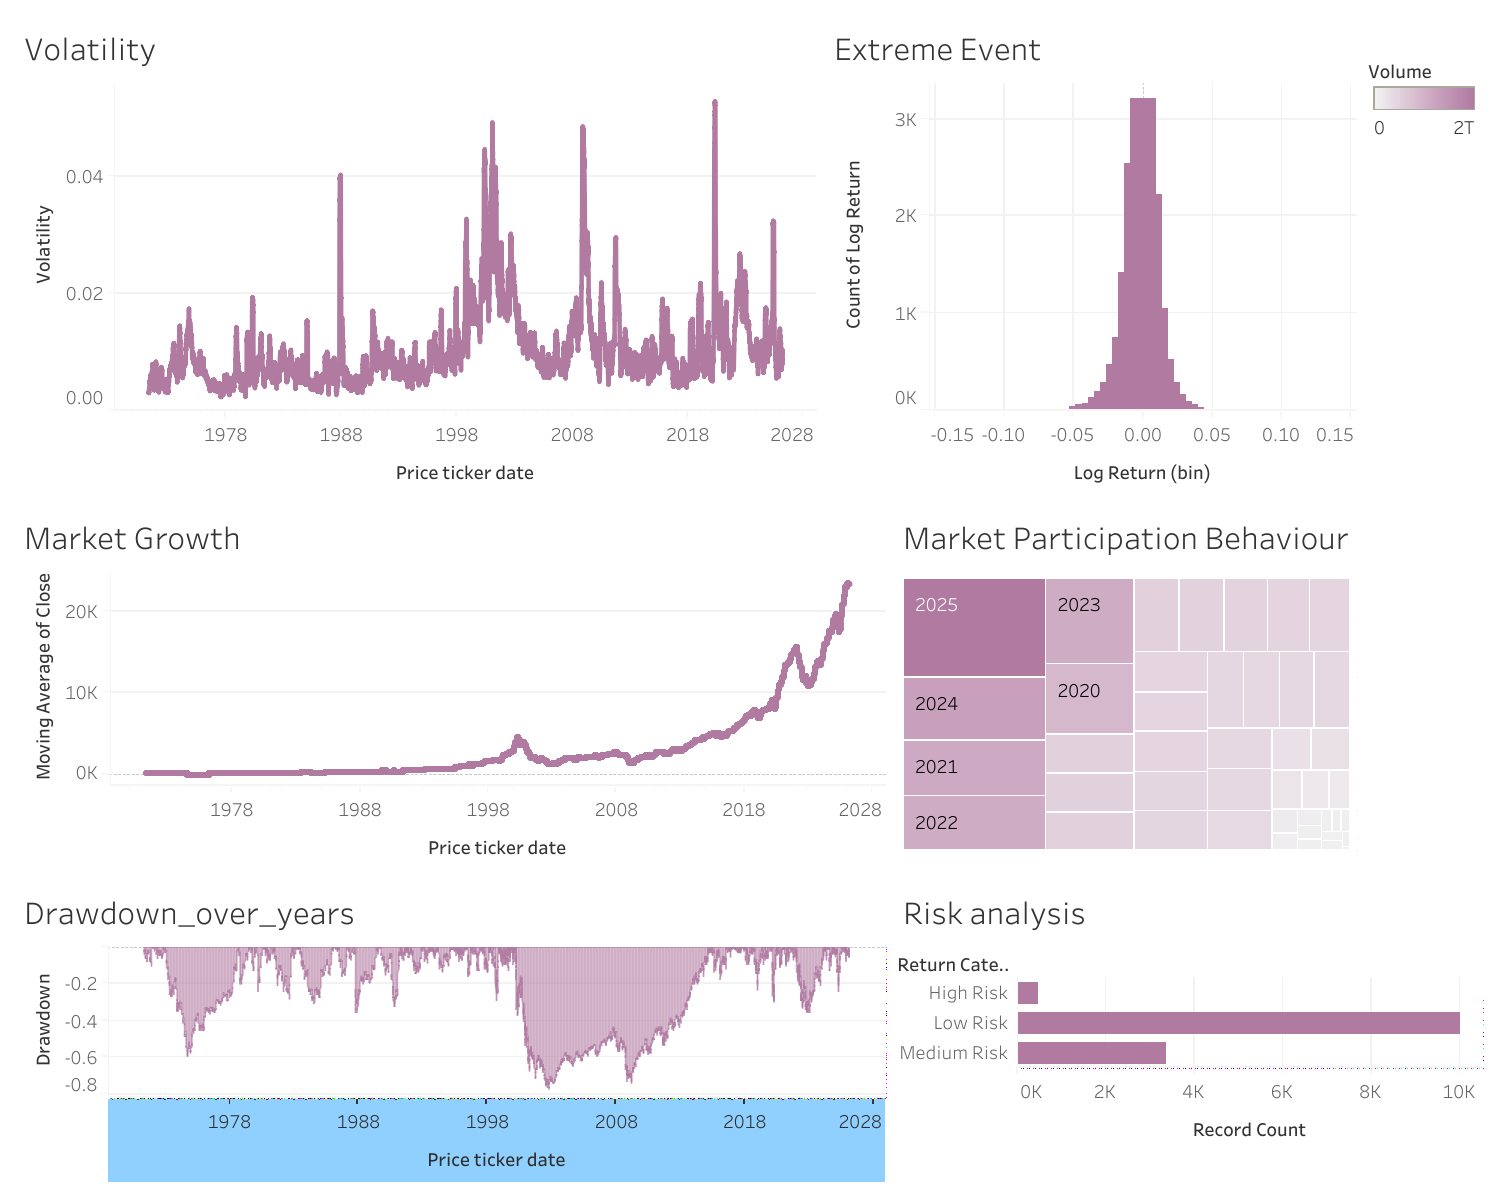
There are long stretches where everything feels calm. Prices move, but nothing dramatic happens. Then suddenly, the calm breaks. Volatility spikes, uncertainty rises, and the market feels unpredictable again. We saw this clearly during the 2008 financial crisis, when volatility surged as global markets struggled under collapsing financial institutions. A similar pattern reappeared in 2020 during COVID-19, when fear and uncertainty drove sharp market swings in a very short time. These moments may feel random when we live through them, but statistically, they follow a pattern - volatility tends to cluster. Once instability begins, it doesn’t disappear immediately; it lingers.
If we look deeper into returns, most days are uneventful. Small gains, small losses — nothing extreme. But occasionally, the market delivers shocks. Big crashes and sharp rallies happen more often than we would expect in a perfectly “normal” system. The 2008 crash wiped out massive value in a short time, while the post-COVID recovery delivered one of the fastest rebounds in history. This tells us something important: extreme events are rare, but they are not anomalies. They are part of how the market works.
And yet, despite all of this, the long-term direction tells a completely different story. Over decades, the market trends upward. Crashes that once felt devastating eventually become small dents in a much larger growth curve. The dot-com bubble, the 2008 crisis, and even the COVID crash all appear as temporary setbacks when viewed over a longer horizon. Growth, it seems, is the market’s default direction — but it demands patience.
What has changed in recent years is participation. The market today is more active than ever, with increased involvement from retail investors, digital platforms, and global access to trading. Events like the COVID-era investing boom brought a new wave of participants, making the market more reactive and sometimes more volatile. The crowd has grown, and with it, the speed at which sentiment shifts.
But perhaps the most emotional part of the story is drawdown - those periods where the market falls sharply and portfolios shrink. These are the moments that test investors the most. In 2008, many saw significant portions of their investments disappear. In 2020, the drop was sudden and terrifying. But history shows that these phases, as painful as they are, do not last forever. Recovery has always followed decline, even if it takes time.
What this entire journey reveals is simple but powerful. The market is not purely random. It moves through cycles - calm periods, turbulent phases, rare extreme events, and long-term growth. Risk is not constant; it hides quietly most of the time and then appears suddenly, making those rare moments disproportionately important.
Understanding this changes how we see investing. It shifts the focus from reacting to every movement to recognizing the bigger pattern. Because in the end, the market is not just numbers on a chart - it is a reflection of human behavior, fear, confidence, and resilience, repeating itself over time.
❤️❤️❤️
2026-04-07 10:58 UTC
❤️❤️❤️❤️👍
Sankari Chakraborty
2026-04-07 10:57 UTC
Then no risk of share market